Eliminating homelessness is an expensive proposition, but we can pay for the great majority of it by simply redirecting money that's already being spent inefficiently on treating homeless individuals on the street.
Read MoreReviewing LA's Homelessness Report, Pt. 3: Key Housing Recommendations
This is Part 3 of my review of the City of Los Angeles' Comprehensive Homeless Strategy report, focusing specifically on the Housing section, which is home to the largest number of recommendations and the lion's share of the cost associated with addressing homelessness. Part 1 covered some background on the homelessness crisis and summarized the types of shelter and housing programs that the City has historically relied on, and may expect to use in the future. Part 2 looked at the efficacy and cost of different homelessness reduction strategies. In this section I review the specific recommendations included in the report.
Recommendations for Addressing Homelessness Crisis
There are a whole bunch of interesting recommendations in the report, and for the sake of brevity (ha), I'll limit this to a few of the key items.
1. Increase Supply of PSH and RRH; Grow Prevention/Diversion Capacity
Based on the CAO's analysis, it won't surprise anyone to learn that the primary recommendation within the Housing section of the report is to increase the supply of Permanent Supportive Housing and Rapid Rehousing units, and to ramp up Diversion and Prevention efforts. They also suggest that we are currently oversupplied with Transitional Housing; this may present an opportunity for conversion to a more effective use.
Current and proposed resources for several homelessness intervention strategies. Table from Comprehensive Homeless Strategy.
Including beds/units for both individuals and families, they propose the following changes (ten-year cost estimates for each program are in parentheses):
- Increase Emergency Shelter beds by 371
- Increase capacity for Prevention/Diversion by 1,230 individuals or households ($22.5 million)
- Increase supply of Rapid Rehousing units by 3,434 ($294 million)
- Decrease the number of Transitional Housing units by 1,844 units (N/A)
- Increase the supply of Permanent Supportive Housing units by 9,895 units ($742 million for construction, $807 million for leases)
The total cost of these programs would be approximately $1.87 billion over 10 years.
The production trends over the next 10 years are graphed below. They show an early dependence on Permanent Supportive Housing leases, which are slowly reined in as new PSH units are constructed. As a long-term housing strategy, construction is favored over leases because it avoids worsening LA's already extremely low rental vacancy rates, which are a major contributor to rising rents. Rapid Rehousing units and Diversion investments are assumed to be made at a consistent rate over the ten-year period.
Projected annual unit production trends over a 10 year period. Graph from Comprehensive Homeless Strategy.
The report recommends an early reliance on PSH leases because construction will take several years to ramp up and we clearly do not have time to wait to address homelessness in the City.
2. Establish Sustainable Funding Stream to Address Homelessness
Many other large cities have established Housing Trust Funds with dedicated funding streams that are reserved for homeless reduction programs. San Francisco is provided as an example: In 2012 the City passed a local ballot measure that captured some of the former redevelopment agency's revenues that had previously been used for affordable housing funding.
The Budget section of the report notes that there are a variety of funding sources potentially available, including a set-aside from the General Fund, affordable/homeless housing benefit fees, increases to parking or hotel taxes, or a bond measure. Regardless of the path our elected leaders take, they should remember that the cost of proactively addressing homelessness must be measured against the cost of doing nothing—in many cases it is far more costly to leave someone on the street than to house them and provide the full wrap-around services that address their challenges directly.
3. Utilize 4 Percent Low Income Housing Tax Credit to Expedite Construction, if Necessary
One challenge to developing over 7,000 units of Permanent Supportive Housing is the ability to secure enough complementary financing (from the state, federal government, etc.) to support the City's roughly $100,00-per-unit contribution. If those non-City funds don't materialize, each new unit would be considerably more expensive. A major hurdle to securing this outside support is Los Angeles' dependence on 9 percent Low Income Housing Tax Credits (LIHTC), which give the City more money but are far more competitive and for which there is limited total funding. An alternative is to finance development primarily using 4 percent tax credits; this option is more expensive for the City—a $150,000 per-unit subsidy rather than $100,000—but is much more easily accessible.
Assuming that every Permanent Supportive Housing unit we build is financed using 4 percent tax credits, the City's development cost would increase from $742 million to $1.1 billion. But realistically, this may be the only way to fund such a large number of PSH units—particularly when we're trying to subsidize thousands of units of low income and moderate income affordable housing at the same time.
4. Expand Adaptive Reuse for Homeless Housing
Taking a cue from the wildly successful Adaptive Reuse Ordinance in downtown LA, which has been widely credited with spurring the revitalization of the area, the authors suggest that adaptive reuse can also be used to expand the supply of Bridge Housing and Permanent Supportive Housing. Aside from providing another route to producing new housing, adaptive reuse has also been found to be slightly cheaper than building new units with similar characteristics.
Homeless housing and service providers already have experience converting buildings from hotel or motel accommodations to housing for the homeless, so the key would be to incentivize continued conversions through additional funding, expansion of Adaptive Reuse Incentive Areas, reevaluation of strict adaptive reuse requirements, and fast-tracking for zoning and permitting processes associated with redevelopment.
The 28th Street Apartments are an adaptive reuse of a former YMCA facility, now equipped with an employment and youth training program and 49 units of supportive housing for the chronically homeless, the mentally ill, and youth exiting foster care. Photo from Architect Magazine.
5. Use Public Land for Affordable and Homeless Housing
The City and County both own a lot of property, and where it isn't be used productively it should be considered as a site for affordable and homeless housing development—especially where underutilized property is transit-accessible. This recommendation aligns with similar policies established elsewhere, such as at Metro, as the growing affordability crisis seems to be turning every governmental body into an affordable housing developer, whether they like it or not.
The upside of developing on public land is two-fold: First, since the City/County already owns the property it doesn't have to spend time negotiating a purchase (or taking through eminent domain) from a private owner. So we get new housing faster. Second, since the land has already been paid for, usually at least several decades ago if not longer, the total cost of development is reduced—an important goal in the face of roughly $2 billion in homeless housing needs.
There's a bunch more in there, but those are some of the most impactful strategies in my view. If you'd like to see the full list, you can download the full Comprehensive Homeless Strategy report and skip to page 119.
Call to Action
The Comprehensive Homeless Strategy is being presented to City Council's Homelessness and Poverty Committee on Wednesday, January 13th at 3:00 PM in City Hall room 340. If you're able to make it, I strongly recommend that you attend and speak in support of the strategies and goals outlined in this report. I'm hoping to set aside some time to attend myself, so hopefully I'll see many of you there!
Thanks for reading!
Reviewing LA's Homelessness Report, Pt. 2: Efficacy and Cost of Housing Strategies
This is Part 2 of my review of the City of Los Angeles' Comprehensive Homeless Strategy report, focusing specifically on the Housing section, which is home to the largest number of recommendations and the lion's share of the cost associated with addressing homelessness. Part 1 covered some background on the homelessness crisis and summarized the types of shelter and housing programs that the City has historically relied on, and may expect to use in the future. In this section I review the relative efficacy of these different programs, and the cost of each.
Efficacy of Homelessness Interventions
Permanent Supportive Housing, Rapid Rehousing, and Prevention are the three homeless interventions from the above list that are most strongly favored in this report, and the preference for these strategies is backed up by empirical evidence in support of their efficacy. Below is a sample of the data presented in the report in support of each approach.
Permanent Supportive Housing (PSH)
There are approximately 9,000 chronically homeless persons in the City of Los Angeles, including about 950 who are living on the streets with their families. The chronically homeless—identified in the Comprehensive Homeless Strategy report as those homeless for at least one year, or including four homeless events totaling 12 months—consume a disproportionate share of public resources and frequently suffer from debilitating medical conditions or disabilities. For this reason it is chronically homeless persons that are best-suited for Permanent Supportive Housing.
Unlike shelters and Transitional Housing, PSH is not time-limited and affords residents a degree of stability that allows them to more effectively address whatever medical or social problems they may face. Residents' likelihood of success is further supplemented by case management and, frequently, on-site mental and physical health programs. The success of this approach is reflected in the retention rates for its residents: After 6 and 12 months over 90 percent of individuals, and over 80 percent of families, are still housed.
Retention rates over 6 and 12 months for chronically homeless residents in Permanent Supportive Housing. Table from Comprehensive Homeless Strategy.
Full independence from public support is an unrealistic goal for a number of homeless persons with especially severe disabilities and other challenges. If the goal of our homeless policy is to keep City residents of the street rather than cycling through relatively ineffective sheltering and transitional programs, Permanent Supportive Housing is an essential component of a comprehensive strategy.
Rapid Rehousing (RRH)
Rapid Rehousing is targeted at homeless persons with a less intense need for public services, and as such it is able to achieve a high rate of success at a lower cost than permanent supportive housing. Since 2013, 93.5 percent of clients served by RRH have remained stably housed.
Prevention
Between September 2009 and October 2011, 4,218 individuals in 1,724 households were served by Prevention programs in Los Angeles. Of these clients, rental assistance was the most common form of financial assistance offered, followed by help with security deposits and utility payments. Every household involved in the Prevention program(s) was engaged in the case management system, and about 60 percent received legal services assistance.
Prevention services are provided at considerably lower cost than sheltering or housing programs; details of the costs for each program type are detailed in the following section.
Costs of Shelter and Housing Programs
A surprising finding from the report (for me at least) is that Emergency Shelters and Transitional Housing are actually more expensive than Permanent Supportive Housing on an annual basis, despite their lower efficacy. Below is a figure from the report that summarizes the estimated cost of many of the programs described above.
Summary of estimated annual costs for several housing programs. Table from Comprehensive Homeless Strategy.
Notice that Emergency Shelter and Transitional Housing, both of which have been de-prioritized by the federal government, are more expensive on an annual basis than PSH. The $15,000 per household for Permanent Supportive Housing includes direct services for residents (such as medical care and mental health treatment) as well as the annualized cost of building new housing or a lease for existing housing. The report estimates a cost of about $351,000 for studio and 1-bedroom apartments and $414,000 for larger units; about $100,000 of that would be picked up by the City. The cost of a lease ranges from about $12,000 to $20,000 per year depending on the size of the unit.
Individuals and families placed in PSH are typically those with the highest Vulnerability Index scores—those deemed highest-priority for housing and possessing the greatest acuity of need. As a result, they are often the most costly in terms of the consumption of public resources such as law enforcement, medical care, and substance abuse treatment programs. As numerous studies have shown, the cost of treating homeless persons on the street can actually exceed the cost of housing them. One such study in Santa Clara County notes that, while homeless residents cost the county an average of $5,148 per person, "individuals with costs in the top 5% accounted for 47 percent of all costs and had average costs of over $100,000 per year." Another, smaller-scale study performed by USC found that providing four homeless individuals with Permanent Supportive Housing actually reduced public service costs by more than $20,000 per person over a two-year period.

In Santa Clara County, homeless residents with public costs in top 5% accounted for 47% of total costs spent on services for the homeless, and individuals averaged over $100k in costs, per person, per year. Chart from Economic Roundtable.
The cost of Prevention, by comparison, is just $3,500 per household. The report rightly views expenditures on Prevention and Diversion as cost avoidance strategies—by spending money on these Prevention, some individuals and families can avoid the need for a more expensive housing intervention.
Some additional data on the relative costs of each option are provided below. Again, note that for PSH, the City would either pay to have new units constructed (capital cost), or would pay for an annual lease—not both.
Summary of City's capital, service, and rental subsidy costs for several housing programs. Table from Comprehensive Homeless Strategy.
Part 3 is up next, where I'll review some of the key recommendations in the Comprehensive Homeless Strategy.
Reviewing LA's Homelessness Report, Pt. 1: Background on Housing Programs
This is Part 1 of a three-part post. Part 2 can be found here; Part 3 can be found here.
The City of Los Angeles just released its Comprehensive Homeless Strategy, and there's a lot of material to cover. The 237-page report is an impressive document not just for its apparent quality and exhaustiveness, but also the time frame within which it was developed—barely more than 3 months, which is a blistering pace even outside of the deliberative halls of government.
Since there's a lot to go through, I've gone through a few sections and would like to summarize for those unlikely to read the whole document. Before reading on, I recommend that readers check out Curbed's (surprisingly detailed and non-snarky) summary of the report's key messages; my own summary will be more focused, with this post specifically looking at the Housing section of the report.
Photo of Alejandro Varas, by Martin Schoeller. Image from the Comprehensive Homeless Strategy.
Why I'm Writing About the Housing Section
The authors of this report acknowledge that housing strategies account for the largest number of proposals as well as the vast majority of the cost associated with their recommendations. It's no coincidence that housing is such an integral component of the report, and I think the report itself best summarizes why:
The decades-long period of underbuilding housing in Los Angeles has contributed to the homelessness of individuals and families and, once homeless, made it difficult for those with vouchers or other benefits to gain housing. Underbuilding housing in the face of increasing demand led by continued population growth in the region has created extremely low vacancy rates. Supply side economics dictate that when demand exceeds supply, prices will rise. This rise has led to conditions where rents continue to increase to the point where low income individuals are paying more than fifty percent of their income on rent; are living in overcrowded, illegal housing; and are commuting long distances, increasing regional traffic, to avoid high housing costs in the urban core.
Low and moderate income Angelenos are a job loss, medical emergency or relationship dissolution away from homelessness. For those forced by personal or economic circumstance to move quickly, vacancy rates lower than New York City mean affordable housing is increasingly difficult to find, thus increasing the likelihood of becoming homeless in a moment of crisis. Los Angeles is last out of 20 major metropolitan regions in the country in producing housing. It is no coincidence that our City is experiencing the highest rates of homelessness in the nation.
To understand the approaches outlined in this report, we first have to be clear on what our options are, starting with the difference between sheltering and housing strategies.
Shelter versus Housing
The Housing section begins by making a distinction between a few different responses to homelessness, described briefly below:
1. Shelter — Shelters serve as a temporary refuge from living in public space. Examples include Emergency Shelter and Winter Shelters, which are only available to homeless individuals or families for short time periods. Because of its relative lack of success in helping homeless individuals move into a permanent, stable housing situation, the federal government and homeless advocates have shifted their focus away from this strategy.
2. Bridge Housing — As the name implies, this type of housing is an interim facility that serves homeless individuals and families as they transition into permanent housing. It is favored over shelter options because it involves one-on-one case management and is more successful at connecting homeless persons with other supportive services.
3. Housing — There are three primary housing types/programs, the first two of which are strongly favored over sheltering strategies because they best align with Housing First policies that have become the gold standard in homelessness reduction efforts. The appropriate program for each homeless individual or family is determined through use of the Vulnerability Index-Service Prioritization and Decision Assistance Tool (VI-SPDAT), which measures the priority for connecting the homeless person or family with housing and support services, as well as the acuity of their need and intensity of services they require.
- Permanent Supportive Housing (PSH) is the most comprehensive response, including non-time-limited housing (hence, "permanent") and a variety of support services to assist those with mental health disorders, disabilities, substance abuse problems, etc. It is reserved for those with high acuity scores in the VI-SPDAT. PSH is particularly well-suited to the chronically homeless, who "often incur significant public costs – through emergency room visits, run-ins with law enforcement, incarceration, and access to existing poverty and homeless programs." There are few pre-requisites, such as sobriety or mental counseling, that homeless persons must meet to be placed in Permanent Supportive Housing; rather, the goal is to provide a level of stability (Housing First) that provides a foundation upon which individuals can address these challenges.
- Rapid Rehousing (RRH) is a less comprehensive housing strategy intended for homeless persons with moderate to lower levels of priority based on their VI-SPDAT score. RRH is time-limited and its scope of services is not as great, with a greater focus on programs that reinforce financial independence, such as employment assistance. Rapid Rehousing's goal is to assist homeless persons and families with their transition away from dependence on public services. RRH is also strongly favored by the report's authors, and is positioned as the alternative to Permanent Supportive Housing for lower-priority, lower-acuity homeless individuals and families.
- Transitional Housing is a time-limited housing option that typically places conditions upon potential residents prior to move-in, unlike Permanent Supportive Housing. Retention rates are lower for Transitional Housing than for PSH and RRH programs, and the federal government and advocates have de-prioritized this type of housing strategy.
4. Prevention and Diversion — These strategies are not forms of housing assistance in a strict sense, but they are nonetheless essential programs that assist vulnerable persons with locating alternatives to entering the homeless system.
Part 2 is up next, where I review the efficacy and cost of each of these program types, as reported in the Comprehensive Homeless Strategy report.
Mapped: All 200 Square Miles of Parking in LA County, As One Giant Parking Lot
What if you took all 200 square miles of parking in Los Angeles County and turned it into one giant parking lot? This map puts into perspective how much space we waste on car storage in LA, and around the country.
Read MoreLow Vacancy Rates Should Demand the Same Urgency as High Unemployment
Here's the thing about unemployment: It sucks for two different but related reasons. The first and most obvious is that when people want jobs but can't get them, life is really tough. The second is more subtle but its impact is much more broadly felt: When there's a surplus of potential employees looking for work, businesses have no incentive to pay people well or give them raises over time. There's always another person desperate to do your job for less money, after all. This is basically the story of the U.S. economy since the Great Recession.
For both of the above reasons, when unemployment rises above about 5 percent we tend to collectively freak out about the need to do something. In our culture, high unemployment is just not an acceptable steady state. Though we tend to focus on the people who are actually jobless, high unemployment affects nearly everyone. It demands action.
Vacancy rates versus rent increases in Seattle. One goes up, the other goes down.
If we look at residential vacancy rates through this same lens, we can see that vacancy is actually the mirror image of unemployment. When vacancy rates are low, rents go up and some may be forced from their homes. Some of those displaced households will be unable to find new housing at an affordable rate and end up homeless, at least temporarily. As with the unemployed in a tough economy, these are the most visible and hardest-hit victims of low vacancy rates.
Just like with unemployment there is a second, broader impact associated with low vacancy rates: The demand for housing exceeds the supply of available units, and renters lose their bargaining power. Again, owners know that there's always someone else who would love your downtown loft, your inner-suburb craftsman, even your crappy 1970s dingbat (sorry LetsGoLA)—and they're willing to pay more for the privilege. Millions of renters end up shoveling a larger and larger share of their incomes toward housing, enriching a relatively small number of property owners while degrading the quality of their own lives.
Above-average unemployment may cost the average person a few percentage points in wage growth in a given year. Low vacancy rates can result in double-digit rent growth year after year after year. Both may result in homelessness. And yet, only one of these crises seems to demand our attention. Only one is considered a crisis at all, really. We demand jobs programs when unemployment is unacceptably high, but only a small chorus of individuals, organizations, and developers demands housing programs when vacancy falls too low. And even among those in support of more housing, their ambitions are often limited to providing a small number of subsidized homes for the hardest-hit, most vulnerable residents.
Multifamily vacancy in LA County has been below 5 percent—often considered the inflection point in the balance of power between landlords and renters—since 2011. And unlike unemployment, which has continued to improve, vacancy rates are only getting worse: vacancy has fallen from 6.1 percent in 2009 to 3.3 percent in 2014, and is forecasted to continue falling for at least the next two years.
Will any of our current plans be enough to turn the ship around, or are we just hoping that the next recession is enough to push more residents out to Dallas, Phoenix, and Las Vegas? As things stand today, it doesn't seem like we're on a path to a long-term solution. Where is the urgency?
LA Metro: It's Time For a More Convenient and Equitable Fare Structure
It's time to abandon the daily, weekly, and monthly pass system and adopt a fare structure built around spending caps. Transit users in Los Angeles would continue to pay $1.75 per ride, with a daily spending cap of $7, weekly cap of $25, and monthly cap of $100—but the possibility of overpaying for transit use would be completely eliminated. It's all the benefits of pay-as-you-go and none of the drawbacks of daily, weekly, and monthly passes.
LA Metro TAP cards.
Most of us have been there: We need to get around the city for the day, so we load some money onto our TAP card for our bus or train fare. We don't know how many transit trips we're going to take for the day, so we play it conservative and buy a fare or two, saving a few dollars off the all-day pass. Come the end of the day, we've taken half a dozen transit trips and spent twice as much as if we'd just bought the day pass in the first place.
Or maybe you're more familiar with the reverse: You expect to use transit quite a bit over the next week, so rather than pay a few bucks for each ride you decide to spring for a weekly pass at a cost of $25. Things come up, plans change, and suddenly you realize you've spent 25 bucks for 7 dollars worth of bus rides. It's the gym membership of transportation spending.
In most cities, LA included, we're expected to make a prediction about how we'll use transit for the next day, week, or month (or even year), and make our fare purchase based on that prediction. If we overestimate our transit usage, we overpay; if we underestimate our transit usage, we overpay.
For infrequent transit users these situations are bearable, though inconvenient and frustrating. The worry that you might make the wrong choice is an annoyance, but little more. If you're a low income worker, a student, or an elderly resident on a fixed income, however—someone who can't afford even minor financial mistakes, or who doesn't always have the cash flow to put up $100 at the same time each month for a 30-day transit pass—this is a serious problem.
It doesn't have to be this way, and it's time the LA Metro and other regional and municipal transit agencies adopt a more equitable, fault-tolerant payment structure. For an example of what it should look like, we can look to Christchurch, New Zealand. (Hat tip to Darren Davis for the example.)
Pay-per-trip, with daily, weekly, and monthly caps
In Christchurch, there are daily and weekly spending caps that eliminate the possibility of overpaying for transit service. This has allowed them to do away with daily and weekly passes entirely.
Instead of purchasing daily or weekly passes, you simply use your fare card as an e-wallet and pay for each trip directly. When you reach the spending cap for the day, any additional trips you take that day are free, exactly as if you'd purchased a day pass—but without the requirement that you pay for all your rides up front. The weekly caps work in exactly the same way.
Per the table below, Christchurch's daily cap is set at $5, and the weekly cap is $25.
Fare structure for the Metrocard in Christchurch, New Zealand.
What this means in Christchurch is that if you take transit to work and back throughout the week, you hit the cap by Friday evening and transit is effectively free for the weekend—not very different from buying a weekly pass on Monday and using it throughout the week. But if you fall ill on Thursday and miss work for a couple days, you end up paying just $15 for the week, saving yourself $10 on bus or train rides you aren't able to take that week.
LA Metro fare prices. Image source: The Travel Guru.
Daily and Weekly passes in Los Angeles are currently $7 and $25, respectively, so the weekly spending cap would be reached earlier here, but the message is the same. With this structure in place no one with a TAP card would ever pay more than $7 in a day, $25 in a week, or $100 in a month using normal service—a claim we definitely cannot make today. It could even capture the additional cost of out-of-zone and premium services such as the Metro Silver Line, without the need to purchase a special pass in advance. We've currently got a lot of people unwittingly donating their money to Metro, an organization that absolutely should not be in the business of over-charging its patrons—particularly when the median household income for those patrons is less than one-third the median income of County households overall.
Even beyond concerns for social and economic justice, this fare structure is also just smart policy for those interested in growing the appeal of public transit. It's yet another step toward more user-friendly transit, eliminating the minor stress of forecasting one's daily and weekly travel and allowing people to just... go. There's something indescribably freeing about a transit system that doesn't require its users to be experts, and the ability to "pick up and go" without any preoccupation is one of the greatest appeals of driving. Transit will need to continually evolve in that direction to compete.
Prior innovations, especially real-time tracking, have dramatically improved the experience of trip-planning and transit use. This evolution in fare policy is by no means so great a leap forward, but it's an obvious and sensible step forward, and the technology is already in place to implement it. What are we waiting for?
If We Can Grow Our Economy With Fewer Carbon Emissions, We Can Grow it With Less Driving, Too
More people are driving—let's all celebrate!! And/or let's build even more roads to encourage more people to join us in our miserable commute!!! Photo by Kim Scarborough.
For the second year in a row the Federal Highway Administration is celebrating the fact that Americans are driving more. They've been using the increase in vehicle-miles traveled to make the case that we need to invest more in our nation's highways, apparently accepting as a given that more driving means more economic activity. Here's Secretary of Transportation Anthony Foxx from last year's announcement:
"More people driving means our economy is picking up speed ... It also means we need to increase our investment in transportation to meet this demand, which is why Congress needs to pass the President's four-year, $302 billion GROW AMERICA Act."
Putting aside the fallacy that more investment in roads will do anything to significantly improve the flow of traffic or reduce travel times—the last $400 billion we spent didn't seem to do us much good—the real error here is in assuming that more driving means a stronger economy, and, worse, that growth is actually dependent upon increasing VMT. We don't see that kind of thinking from the Obama administration when it comes to the connection between GDP growth and carbon emissions; I would challenge the White House and our elected leaders to apply to transportation the same vision and zeal with which they've approached climate change.
ECONOMIC GROWTH AND CARBON EMISSIONS: "DECOUPLING"
Historically it's been believed that economic growth could only occur alongside increasing carbon emissions, and the actual experience of most countries had borne that out.
More recently, though, we've learned that the link between economic growth and emissions isn't as ironclad as it once seemed. Plenty of countries have managed to get richer at the same time they've reduced their carbon footprint, a process known as "decoupling": Sweden, for example, decoupled its growth from emissions way back in the mid-1990s, so this isn't exactly a cutting-edge concept. Economy/Emissions decoupling appears to have manifested at the global level, too, with a recent report from the International Energy Agency finding that carbon emissions held steady from 2013 to 2014 while the global economy grew by 3 percent.
None of this is news to the Obama administration. The White House noted in its 2013 Climate Action Plan that "in 2012, U.S. carbon emissions fell to the lowest level in two decades even as the economy continued to grow." The recognition that we can reduce carbon emissions and still grow the economy is a key selling point for the president, essential for generating support for regulations that seek to shut down coal-fired power plants and promote renewable energy investments.
All of which begs the question, shouldn't we be able to achieve a similar decoupling of economic growth and vehicle-miles traveled? Better yet, according to the data, haven't we already done so?
ECONOMIC GROWTH AND VEHICLE-MILES TRAVELED: DECOUPLING?
Consider the following graph, which shows changes to real GDP and vehicle-miles traveled over the past 45 years:
Note that up until the late 1990s GDP growth and VMT tracked one another very closely. Then, all of a sudden, they didn't: Since the mid-2000s in particular, we've seen virtually no increase in vehicle-miles traveled (and a reduction in per capita VMT), while GDP climbed well above its pre-recession peak.
The next graph compares GDP to VMT, subtracting annual growth (%) of VMT from GDP for each year since 1970. (For example, in 1992 U.S. GDP grew by 3.5 percent and VMT grew by a little over 2.5 percent, so the difference is right around 1 percent—that is, GDP grew by 1 percent more than VMT in that year.) This helps illustrate the connection between the two measures, and over the past 45 years it shows a pretty clear trend toward economic growth being less and less dependent on driving.
There's significant variability from year to year, but while in the past it was common for VMT growth to exceed GDP growth (i.e., the difference between the two falls into negative territory in the above graph), it's happening with much less frequency today. Not only has GDP been growing faster than vehicle miles in recent years, the average difference between the two has also grown. The decoupling of economic growth and driving became painfully apparent immediately before and in the years since the Great Recession, but what this data shows is that this disconnect has been progressing, albeit slowly, for decades.
Looking back even further, using data from the Highway Administration and Bureau of Economic Analysis, the difference between recent years and earlier generations becomes even clearer:

COMMITTING TO A "DECOUPLED" FUTURE
If the past several decades have taught us anything, it's that just because things worked one way for a long time doesn't mean they'll work that way forever. Increasing productivity used to mean growing wages, and that's no longer the case—at least for now. On the more positive side, technological and societal changes mean that economic growth is no longer as dependent on pumping carbon into the atmosphere and spending more and more time sitting behind the wheels of our cars.
Unfortunately, while our elected and appointed leaders are decrying the disconnect between productivity and wages, and celebrating the decoupling of economic growth and carbon emissions, most have yet to accept the fundamental shift in the role of transportation in our lives and in our economy. Organizations like the Federal Highway Administration are still married to an outmoded view that more roads mean more driving, and more driving means a stronger economy. They're right about the first part, at least.
We need them to understand that the world they knew is gone. That it's entirely possible to build a more robust economy without doubling down on additional road investments—road investments that so often fail to recognize the moral, social, environmental, and economic value of less car-dependent, human-scale cities and towns. The economic justification that "more roads equals more growth" is no longer tenable because it's no longer true, and transportation departments at every level of government need to come to terms with that new reality and adjust their priorities accordingly.
The Irony of Selling Oil Reserves to Pay for Highway Expansion
The Bryan Mound Strategic Petroleum Reserve site, one of several in the U.S., is capable of holding 226 million barrels of oil. Source: The Center for Land Use Interpretation.
Unsurprising news from Politico and Streetsblog says that the U.S. Senate has put together a whole grab bag of one-off gimmicks to fund federal transportation programs for another few years, but one idea stood out to me as particularly ludicrous: selling off $9 billion worth of the nation's Strategic Petroleum Reserves (SPR) to help pay for more highway construction.
Tanya Snyder at Streetsblog emphasized how this is just the latest in a series of "gimmicky pay-fors" that have resulted from Congress's unwillingness to embrace higher gas taxes, despite the fact that the federal gas tax has just over half as much impact on consumers today as when it was last raised in 1993. Politico's article focused on how this idea runs counter to the whole "strategic" aspect of the SPR, which is intended to serve as a buffer against supply disruptions if disaster or war threatens the global flow of oil—not a piggy bank to be tapped any time legislators can't find the courage to make more economically sustainable decisions.
Putting aside the cowardly and economically unsustainable nature of these recommendations, however, I'd just like to draw attention to the incredible irony of the sale of strategic oil reserves to fund highway expansion. These senators are proposing that we invest even more in our already-overbuilt highway network and that we pay for it by chipping away at the protections that keep an oil-dependent economy stable. They're looking to bolster our long-term dependence on the global supply of oil while at the same time increasing our vulnerability to disruptions of that supply. How can you write this into federal law with a straight face? Did we just get trolled by a U.S. Senator?
So much of our state and federal transportation programs seem built around a penny-wise, pound-foolish approach to infrastructure investment, but I've yet to see that mindset more perfectly encapsulated into an explicit policy proposal. Fortunately there are senators on both sides of the aisle in opposition, but this isn't the first time an SPR sell-off has been used to fund non-critical programs, and I don't think it's the last we'll hear of it.
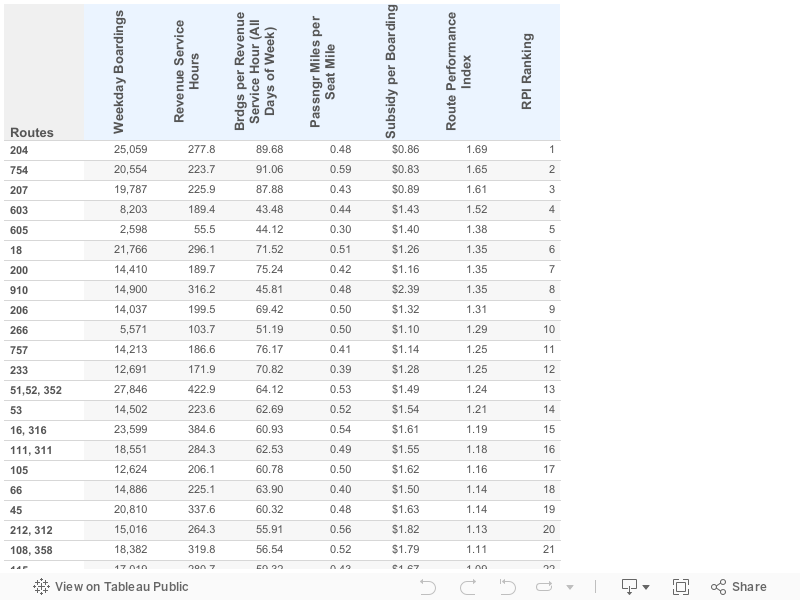
Route Performance Index Results For Every LA Metro Bus Line
Los Angeles Metro has developed a new metric to help it objectively evaluate how its bus lines are doing on a few key measures: subsidy per passenger, riders per hour of service, and share of seats filled throughout the day. It's called the Route Performance Index, and the results are helping Metro design a new, expanded frequent transit network. The RPI allows them to identify laggards in the bus network, eliminate or alter those services, and repurpose the saved hours into better-performing lines, ultimately covering a larger share of the county in high-quality transit service that runs every 15 minutes or less. If you're interested in learning more about it, I suggest reading Jarrett Walker's post at his blog, Human Transit.
I wasn't able to find the results of the evaluation, except for this presentation that identifies the worst-performing lines in the network, so I asked Metro to send it to me. (Thanks Public Records Act!)
I got it yesterday and don't have time to do any real analysis of the numbers, but I wanted to share it as a public resource for anyone interested in diving into the details. In addition to subsidy per boarding, passengers per revenue service hour, and passenger miles per seat mile for each line, it also has information on total daily weekday boardings, daily revenue service hours (not sure if these are scheduled or actual), the RPI value (the highest is 1.69, the lowest is 0.27), and the ranking according to RPI score. You can find all the data in the Tableau table below, or you can download the original Excel file from this Dropbox link. Have fun!