Is construction in downtown LA somehow responsible for rent increases in neighborhoods like Venice and West Adams, where rents have gone up just as fast despite essentially no new homes being added?
It's a common argument among anti-growth activists that new housing development—which in places like Los Angeles has been overwhelmingly targeted at higher earners—is the cause of the affordability crises in many of our nation's cities.
They believe that the normal rules of supply and demand do not apply because new housing actually creates additional demand. Housing is just different. Whether it's because of the restaurants and retail that accompany new homes, or an effect of having more affluent neighbors, or just a result of general trendiness, trying to provide enough new housing to meet skyrocketing demand is a self-defeating proposition, in their view. Admittedly, at the neighborhood level there is something to this. The turnaround time on new development is a years-long process, while demand for an area can shift dramatically over a period of just a few months. So I'll freely admit that new development has some impact.
But here's what I've never understood about these arguments: If new development or speculation in "hot" markets like Hollywood and Downtown is why rents keep getting jacked up and up and up, why do we seem to be seeing the same phenomenon in cities and neighborhoods with extremely limited development—places like Sherman Oaks, Beverly Hills, Hancock Park, Alhambra? These are locations not only with limited development over the past 10-15 years, but with limited prospects for it in the future. By and large, they are not the types of places that are in danger of being upzoned to allow development of 20-story towers (or even 5-story mid-rises), and yet rents and home prices have climbed in these neighborhoods, right alongside those of more development-friendly locales.
When we compare the change in median rent to the change in total housing units in each LA County ZIP code, or the change in median value in the case of owner-occupied units, we see essentially no relationship. Where new development has been heaviest, prices went up a lot. Where development has been almost entirely absent, prices went up a lot.
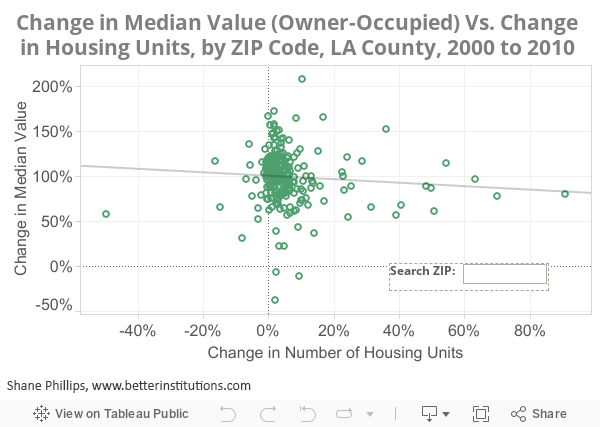
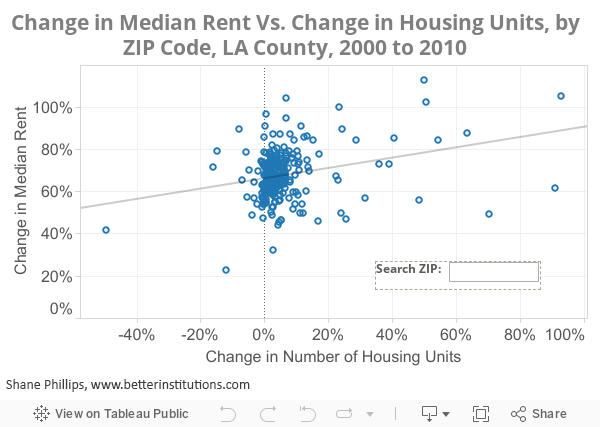
Aside from a few outliers in downtown LA ZIP codes, where median rents in 2000 were skewed extremely low by large quantities of single-room occupancy (SRO) and other affordable/homeless housing resources, prices went up pretty similarly everywhere. Here's a image of the adjusted trend line when you remove those downtown outliers (ZIP codes 90013, 14, 15, 17):
The slightly upward-moving trend line drops even further when downtown LA outliers are removed.
It didn't matter much if you were in a "hot" market or not. Whether you built a little or a lot, housing prices went up by around 50 to 150 percent just about everywhere—with the whole spectrum of price changes visible just within the subset of neighborhoods where no new housing was added at all. Median rent went up about 50 to 80 percent no matter where you lived, generally, with a visible but very weak correlation between price and growth in a few ZIP codes. Single family neighborhoods got more expensive right alongside multifamily ones, even though single family parcels are at zero risk of upzoning to higher densities—especially through City Council "spot zoning" actions. So much for the "spot zoning is the cause of unaffordable housing" argument made by Neighborhood Integrity Initiative supporters.
(Also, if statistics are your thing, the r-squared value for median rent is 0.08; for the median value of owner-occupied housing, it's 0.09. As ever, correlation is not causation, but the correlation here is very, very limited. A shotgun blast into the side of a barn might yield a stronger correlation than the one on display here.)
It's also crucial to point out that the ZIP codes which saw total housing units almost double over this time period would be expected to see significant increases in median rent even if the price of existing units didn't change at all. Take a hypothetical neighborhood with 1,001 homes, a median rent of $500, and a maximum rent of $1,000/month. If we built an additional 1,000 units in that neighborhood, and all of them were market-rate and cost more than $1,000/month, the new median rent—the unit smack in the middle of the distribution—would be $1,000, because it would be equal to the rent of the most expensive home out of the original 1,001 homes.
In that example we've already got a 100% increase in median rent before accounting for typical rent increases that occur in nearly every neighborhood over a period of years, or for whatever limited impact new development has on existing units. If you look back at the above median rent chart, you'll see many ZIP codes that experienced more than 80 percent rent growth even though they saw essentially zero new development—or even a net reduction in housing units. With this in mind, the impact of new development on existing housing prices is probably overstated in the above charts and r-values to some extent.
Prices in the growing neighborhoods are changing at essentially the same rates as the prices in static, unchanging neighborhoods. Something else must be responsible for the rapid growth of rents and home values in LA County.
If It's Not New Development, Then What Is It?
So why are rents and values going up at about the same rates in every neighborhood, regardless of the amount of housing that they've added? The problem obviously isn't new development. A few thousand new units here and there each year is not the reason Los Angeles and other coastal cities are in a frenzy. We're a city of 4 million people and about 1.4 million homes; 10,000 units each year would put us at a growth rate well under 1 percent. Compared against the physical scale of the city, it's just not a big deal. Seattle's actually growing about four times faster than us and they haven't fractured off into the sea, Escape From LA style, or turned into some dystopian hellscape (also Escape From LA style).
The real problem? It's the vacancy rate, stupid. As I wrote in my summary of the reasons to oppose the deceptively-named Neighborhood Integrity Initiative, Los Angeles is now going on five years with vacancy rates under 5 percent. Over that whole period we've actually continued to head in the wrong direction, with rental vacancies now at a historic low of 2.7 percent. People keep moving to Los Angeles—and why wouldn't they, other than the high cost of housing?—and we're doing almost nothing to accommodate them. When they arrive, instead of finding landlords eager to entice them into their units they're running into a dozen other potential tenants at the open house, and landlords who are able to pawn the unit off to the highest bidder.
We tend to focus on local impacts when we talk about housing development, but the effect of low vacancy rates is regional in nature. Someone who can afford $1,500 a month might prefer to live downtown but not find a suitable place at that price, so they may look to somewhere like Hollywood or Koreatown instead. The property owner in Koreatown may ask for $1,500 a month in a unit that rented 2 years ago for $1,250—the demand is higher now than it was 2 years ago, and there's not a whole lot more housing, so he might just get it. The next person moving to LA might have been preferred to live in Koreatown, but her $1,300 a month doesn't go far enough there anymore, so maybe she gives Chinatown a try instead. And down the economic ladder we go, driving up prices all along the way.
It's this regional impact that explains why prices are going up even in neighborhoods with very little new development, proximity to new development, or prospects for future housing development (think Venice, Palos Verdes, or Pacific Palisades). It's the regional vacancy rate, not local development, that's driving the rapid escalation in housing prices. And just as we'd expect, when we look at many of the largest cities in the U.S. we see that as vacancies fall, prices go up.
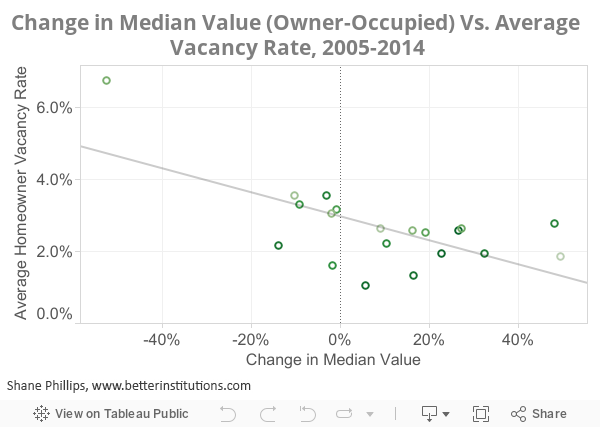
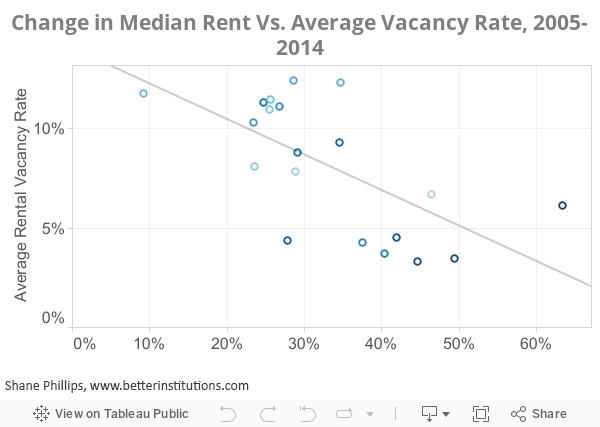
The connection between price increases and regional vacancy rates is much clearer than the connection to new housing development, with an obvious trend toward larger price increases as average vacancy rates fall. Again, if you're into stats, this has an r-squared value of 0.37 for owner-occupied housing and 0.42 for rental units—not a perfect correlation by any means, but much, much higher than the r-squared values for changes in housing counts at the ZIP code level.
Similar metro area vacancy data compiled by the NYU Furman Center shows that the most expensive markets in the nation—which are in the midst of the most severe affordability crises—also have the lowest vacancy rates. Boston, Los Angeles, New York, and San Francisco are all struggling, but they've yet to respond with a program of housing construction that rises to the challenges posed by growing demand.
Cities like Boston, LA, New York, and San Francisco have some of the most expensive housing in the country—and some of the lowest vacancy rates. Chart from the NYU Furman Center.
As I've argued over the past few months (years), we need to treat low vacancy rates as seriously as we do high unemployment. Both have profound impacts on the quality of life of our residents, and both can do permanent harm if left unresolved. In the case of prolonged unemployment that means permanently reduced earning capacity and even years off your life; in the case of low vacancy rates it means rapid and most likely irreversible increases in the cost of housing. Once you become San Francisco, you don't just go back to being Oakland when you finally get things figured out. You're stuck with high prices and all the negative consequences that go along with them.
To be clear, providing enough housing is not a panacea. As Rick Jacobus wrote recently, "[w]e can’t build our way out of the housing crisis … but we won’t get out without building." It's an essential component, and the most important priority, but it won't be enough on its own. We still need more resources for subsidized affordable housing to help our lower-income and homeless neighbors, but if we don't address the housing shortage then all our subsidies and mandates will amount to little in the grand scheme of things. Conveniently, new market-rate units are a great source of surplus revenues to help subsidize affordable housing.
So next time someone tells you that a new development is responsible for rents going up in your neighborhood, remember Venice, and Brentwood, and Ranch Palos Verdes. These are places that have grown in value just as fast as your own community, wherever you live, and they've built virtually no new housing over the past decade. Their prices have gone up because housing is scarce in these locations, as it is across the region, and low vacancies are the expression of that scarcity. If we're going to resolve this crises, we'll need to act like good liberals and welcome our new neighbors with open arms—and open homes, which we need to start building as quickly as possible.
A few notes about methodology:
For the Housing Units vs Median Value chart, Census data was used from 2000 and 2010. I removed all ZIPs with no housing units, those with less than 1,000 units in 2000, those with a median value over $1M in 2000 (2 ZIPs), and those with a median over $1M in 2010 (15 ZIPs, including 2 from 2000). The Census only listed values up to $1 million (anything over $1 million was listed as "$1M+"), so the change in median value couldn't be accurately calculated. Since these were ZIP codes that were already far out of reach to the average family anyway, it wasn't considered a problematic to remove them.
For Housing Units vs Median Rent, Census data was also used. ZIP codes with gross rent over $2,000 were removed for the same reason as those with median values greater than $1 million. There were zero such ZIP codes in 2000, and ten in 2010.
For the charts comparing changes in median rent and median value to average vacancy rate, American Community Survey data was used for each year. The analysis was limited to the largest 20 cities in the U.S. Since this data was at the city level, 1-year estimates from the ACS are quite accurate; 1-year data at a ZIP code level, in contrast, would have had an unacceptably high margin of error. The average vacancy rate was calculated by averaging the vacancy rate for each year from 2005 to 2015. American Community Survey data was used rather than Census data because the ACS allowed for vacancy rates during each year to be taken into account. Census data would have only provided two points in time and therefore would have failed to account for periods of high or low vacancies in the intervening years, which would have an impact on the cumulative change to rent prices and median values in the final year of analysis.